|

SoundMixer.computeSpectrum()
メソッドを使用すると、現在再生されている波形の生のサウンドデータを、アプリケーションで読み取ることができます。複数の SoundChannel オブジェクトが再生中である場合、
SoundMixer.computeSpectrum()
メソッドでは、すべての SoundChannel オブジェクトが混合されたサウンドデータが示されます。
サウンドデータが返される方法
サウンドデータは、ByteArray オブジェクトとして返されます。このオブジェクトは 512 個の 4 バイトデータのセットを含み、各データは -1 ~ 1 の範囲の浮動小数点数値を表します。これらの値は、再生されているサウンド波形内のポイントにおける振幅を表します。値はそれぞれが 256 個の値から成る 2 つのグループとして提供され、第 1 のグループは左ステレオチャンネルを表し、第 2 のグループは右ステレオチャンネルを表します。
SoundMixer.computeSpectrum()
メソッドは、
FFTMode
パラメーターが
true
に設定されている場合は、波形データではなく周波数スペクトルデータを返します。周波数スペクトルは、最低周波数から最高周波数へと、サウンドの周波数順に並べられた振幅を示します。波形データを周波数スペクトルデータに変換するには、高速フーリエ変換(FFT)が使用されます。結果の周波数スペクトルの値は、0 から約 1.414(2 の平方根)の範囲になります。
次の図は、
computeSpectrum()
メソッドから返されるデータを、
FFTMode
パラメーターが
true
の場合と
false
の場合で比較したものです。この図に使用したサウンドは、左チャンネルが大きいベース音で、右チャンネルがドラムを叩く音です。
computeSpectrum()
メソッドは、より低いビットレートで再サンプリングされたデータを返すこともできます。一般にはこのようにすると、音の細部は損なわれますが、より滑らかな波形データまたは周波数データが得られます。
computeSpectrum()
メソッドのデータをサンプリングするレートは、
stretchFactor
パラメーターで制御します。
stretchFactor
パラメーターを 0(デフォルト値)に設定すると、サウンドデータは 44.1 kHz のレートでサンプリングされます。
stretchFactor
パラメーターの値が 1 大きくなるごとに、レートは半分になります。したがって、値に 1 を指定するとレートは 22.05 kHz、値に 2 を指定するとレートは 11.025 kHz、となります。
stretchFactor
の値を高くしても、
computeSpectrum()
メソッドはステレオチャンネルごとに 256 個の浮動小数点数値を返します。
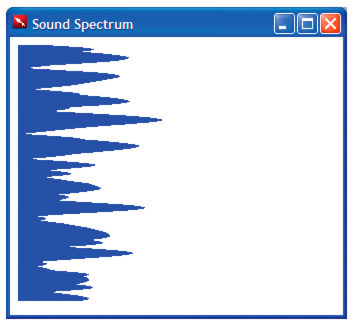
簡易なサウンドビジュアライザの作成
次の例では、
SoundMixer.computeSpectrum()
メソッドを使用して、周期的にアニメーション動作するサウンド波形のグラフを表示します。

<html>
    <title>Sound Spectrum</title>
    <script src="AIRAliases.js" />
    <script>
        const PLOT_WIDTH = 600;
        const CHANNEL_LENGTH = 256;

        var snd = new air.Sound();
        var req = new air.URLRequest("test.mp3");
        var bytes = new air.ByteArray();
        var divStyles = new Array;

        /**
            * Initializes the application. It draws 256 DIV elements to the document body,
             * and sets up a divStyles array that contains references to the style objects of
             * each DIV element. It then calls the playSound() function.
             */
        function init()
        {
            var div;
            for (i = 0; i < CHANNEL_LENGTH; i++)
            {
                div = document.createElement("div");
                div.style.height = "1px";
                div.style.width = "0px";
                div.style.backgroundColor = "blue";
                document.body.appendChild(div);
                divStyles[i] = div.style;
            }
            playSound();
        }
        /**
             * Plays a sound, and calls setInterval() to call the setMeter() function
             * periodically, to display the sound spectrum data.
             */
        function playSound()
        {
            if (snd.url != null)
            {
                snd.close();
            }
            snd.load(req);
            var channel = snd.play();
            timer = setInterval(setMeter, 100);
            snd.addEventListener(air.Event.SOUND_COMPLETE, onPlaybackComplete);
        }

        /**
             * Computes the width of each of the 256 colored DIV tags in the document,
             * based on data returned by the call to SoundMixer.computeSpectrum(). The
            * first 256 floating point numbers in the byte array represent the data from
             * the left channel, and then next 256 floating point numbers represent the
             * data from the right channel.
             */
        function setMeter()
        {
            air.SoundMixer.computeSpectrum(bytes, false, 0);
            var n;
            for (var i = 0; i < CHANNEL_LENGTH; i++)
            {
                bytes.position = i * 4;
                n = Math.abs(bytes.readFloat());
                bytes.position = 256*4 + i * 4;
                n += Math.abs(bytes.readFloat());
                divStyles[i].width = n * PLOT_WIDTH;
            }
        }
        /**
         * When the sound is done playing, remove the intermediate process
         * started by setInterval().
         */
        function onPlaybackComplete(event)
        {
            clearInterval(interval);
        }
    </script>
    <body onload="init()">
    </body>
</html>
この例では、まずサウンドファイルを読み込んで再生し、次に
setInterval()
関数を使用して
SoundMixer.computeSpectrum()
メソッドを監視し、サウンド波形データを
bytes
ByteArray オブジェクトに格納します。
サウンド波形は、棒グラフを表す
div
エレメントの幅を設定して描画します。
|
|
|