- Not Viewed Topics
- Lists the topics in the selected area/areas, that have not been
viewed by the users in the selected period of time. Use the Not
Viewed Topic list to:
- Display the results in a table with details about file name, project, project area, and server file path.
- Additional columns can be added by clicking on Add/Remove Columns icon to the top right of the table.

- Search Terms with No Results
Search terms that returned no results and the number of times that users searched for them. Use the Search terms with no results to:
- Check the terms which users are seeking information.
- Display the frequency of search term.

- Frequently Searched Terms
- Lists the most frequently entered search terms. Useful in identifying areas of an application that may require reworking / redesign. Use the Frequently Searched Terms list to:

- OS statistics
- Lists the usage of most preferred operating system used by the
end users. This is useful to identify the popular operating system
for better optimization. Use the OS statistics list to:
- Display the usage trend of Operating System to view the help file as a bar or pie chart.

- Browser statistics
- Lists the browsers used to search content. This is helpful in
tracking the preferred trend of browser usage. Use the Browser statistics
list to:
- Display the usage of web browsers used to search the help content as a bar or pie chart.
- Display the requests in percentage as per the browser usage.

- Pages per visit
- Displays the number of pages visited by a user within a browsing
session. This is displayed as an average of total number of page
views divided by the total number of visitors on a given day. Use
the Pages per visit to:
- Display the average pages per visit as a function plot graph.
- Display reports on a weekly basis over a particular period.

- Page views
- Displays the count of page views received for different pages
in the help system. This helps in analyzing the performance of the
content and do a timely review of pages with lesser number of views.
Use the Page views to:
- Display the total number of views for each page in the help file as a function plot graph.
- Display reports on a weekly basis over a particular period.

- Frequently Viewed Topics
- Lists the most frequently viewed topics. Like the frequently
searched terms report, this is useful in identifying troublesome
areas. Additionally it can be a useful indication of how many end
users are using new functionality. Use the Frequently Searched Terms
list to:
- Display the detail of the feedback analytics below the bar chart.
- Configure the report’s detail column.

- Usage Statistics
Chronological graphical report of the number of hits to the Help system as a whole. Pages searched for and not opened reflect in this list. The usage statistics report has four additional tabs.
- Page Views
Number of pages viewed over a given window of time. The window of time is determined by the labels along the X axis.
- Pages Per Visit
Number of pages viewed per visit. Every instance when a user opens the project is considered as a separate visit. Visits from different Web browsers are counted separately.
- Browser
Comparative data about the Web browsers in which users viewed the Help content.
- OS
Comparative data about the operating systems on which users viewed the Help content.

- Search Trends
The percentage of search terms that returned no results. The detailed view of this report gives the total number of search terms and how many of them returned results/no results. Use the Search Trends list to:
- Color-coded representation for searches with results and those with no results.
- The option to suppress the report detail.

- Help System Errors
Error messages encountered by the current logged-in user. Use the Help System errors to:
- List all the errors faced by the user when accessing the help system.
- Track missing map id’s, invalid or missing window definitions.

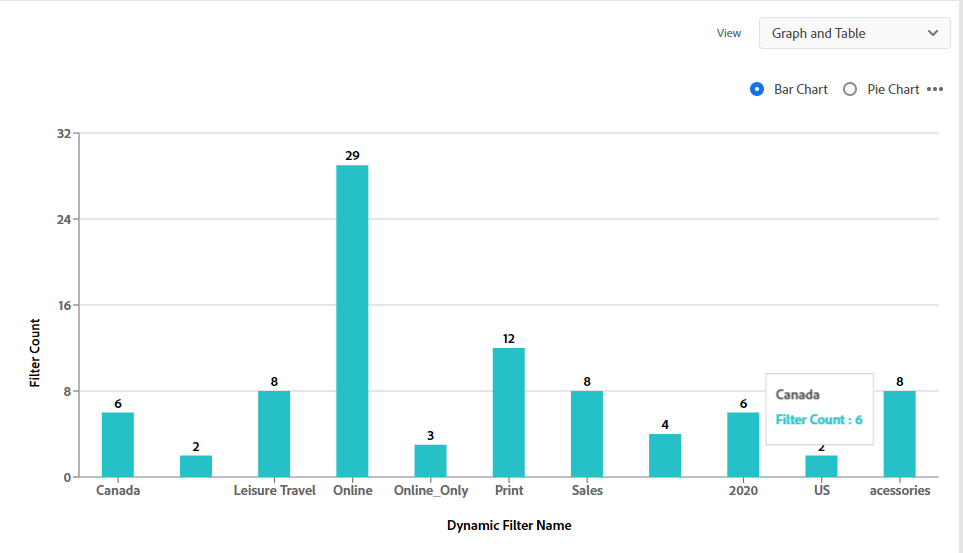
- Frequently Used Dynamic Filters
- Lists the dynamic filters that end users use most often to generate personalized content. Use the frequently Used Dynamic Filters list to: