|

The
SoundMixer.computeSpectrum()
method
lets an application read the raw sound data for the waveform that
is currently being played. If more than one SoundChannel object
is currently playing, the
SoundMixer.computeSpectrum()
method
shows the combined sound data of every SoundChannel object mixed
together.
How sound data is returned
The sound data is returned as a ByteArray object containing
512 four-byte sets of data, each of which represents a floating
point value between -1 and 1. These values represent the amplitude
of the points in the sound waveform being played. The values are
delivered in two groups of 256, the first group for the left stereo
channel and the second group for the right stereo channel.
The
SoundMixer.computeSpectrum()
method returns
frequency spectrum data rather than waveform data if the
FFTMode
parameter
is set to
true
. The frequency spectrum shows amplitude
arranged by sound frequency, from lowest frequency to highest. A
Fast Fourier Transform (FFT) is used to convert the waveform data
into frequency spectrum data. The resulting frequency spectrum values
range from 0 to roughly 1.414 (the square root of 2).
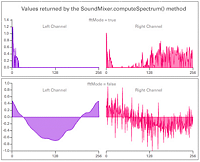
The following diagram compares the data returned from the
computeSpectrum()
method
when the
FFTMode
parameter is set to
true
and
when it is set to
false
. The sound used for this
diagram contains a loud bass sound in the left channel and a drum
hit sound in the right channel.
The
computeSpectrum()
method can also return
data that has been resampled at a lower bit rate. Generally, this
results in smoother waveform data or frequency data at the expense
of detail. The
stretchFactor
parameter controls
the rate at which the
computeSpectrum()
method
data is sampled. When the
stretchFactor
parameter
is set to 0, the default, the sound data is sampled at a rate of
44.1 kHz. The rate is halved at each successive value of the
stretchFactor
parameter.
So a value of 1 specifies a rate of 22.05 kHz, a value of 2 specifies
a rate of 11.025 kHz, and so on. The
computeSpectrum()
method
still returns 256 floating point values per stereo channel when
a higher
stretchFactor
value is used.
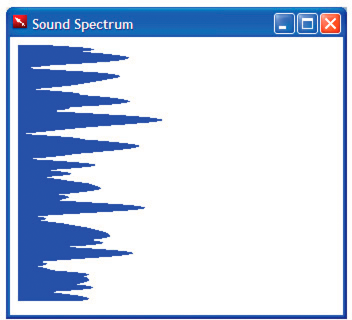
Building a simple sound visualizer
The following example uses the
SoundMixer.computeSpectrum()
method
to show a chart of the sound waveform that animates periodically:
<html>
    <title>Sound Spectrum</title>
    <script src="AIRAliases.js" />
    <script>
        const PLOT_WIDTH = 600;
        const CHANNEL_LENGTH = 256;

        var snd = new air.Sound();
        var req = new air.URLRequest("test.mp3");
        var bytes = new air.ByteArray();
        var divStyles = new Array;

        /**
            * Initializes the application. It draws 256 DIV elements to the document body,
             * and sets up a divStyles array that contains references to the style objects of
             * each DIV element. It then calls the playSound() function.
             */
        function init()
        {
            var div;
            for (i = 0; i < CHANNEL_LENGTH; i++)
            {
                div = document.createElement("div");
                div.style.height = "1px";
                div.style.width = "0px";
                div.style.backgroundColor = "blue";
                document.body.appendChild(div);
                divStyles[i] = div.style;
            }
            playSound();
        }
        /**
             * Plays a sound, and calls setInterval() to call the setMeter() function
             * periodically, to display the sound spectrum data.
             */
        function playSound()
        {
            if (snd.url != null)
            {
                snd.close();
            }
            snd.load(req);
            var channel = snd.play();
            timer = setInterval(setMeter, 100);
            snd.addEventListener(air.Event.SOUND_COMPLETE, onPlaybackComplete);
        }

        /**
             * Computes the width of each of the 256 colored DIV tags in the document,
             * based on data returned by the call to SoundMixer.computeSpectrum(). The
            * first 256 floating point numbers in the byte array represent the data from
             * the left channel, and then next 256 floating point numbers represent the
             * data from the right channel.
             */
        function setMeter()
        {
            air.SoundMixer.computeSpectrum(bytes, false, 0);
            var n;
            for (var i = 0; i < CHANNEL_LENGTH; i++)
            {
                bytes.position = i * 4;
                n = Math.abs(bytes.readFloat());
                bytes.position = 256*4 + i * 4;
                n += Math.abs(bytes.readFloat());
                divStyles[i].width = n * PLOT_WIDTH;
            }
        }
        /**
         * When the sound is done playing, remove the intermediate process
         * started by setInterval().
         */
        function onPlaybackComplete(event)
        {
            clearInterval(interval);
        }
    </script>
    <body onload="init()">
    </body>
</html>
This example first loads and plays a sound file and then uses
the
setInterval()
function to monitor the
SoundMixer.computeSpectrum()
method,
which stores the sound wave data in the
bytes
ByteArray
object.
The sound waveform is plotted by setting the width of
div
elements
representing a bar graph.
|
|
|